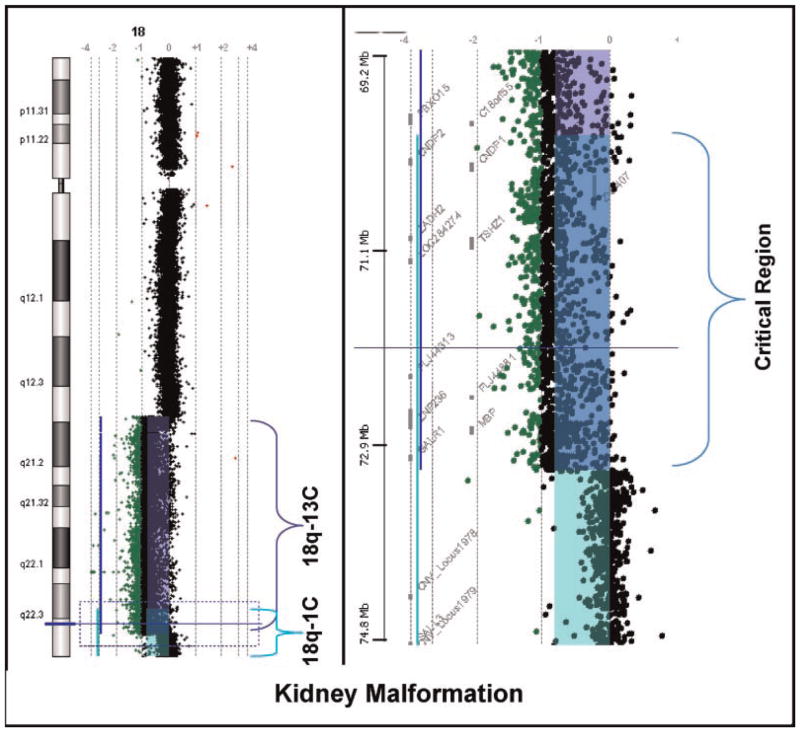
FIG. 2.
Oligonucleotide array comparative genomic hybridization microarray (aCGH) data for the two participants whose deletions define the smallest common hemizygous region for kidney malformations. The colored bars indicate the location of features that are significantly different from 0 on the log2 scale; purple for participant 18q-13C and green for participant 18q-1C. Features exactly on the 0 vertical axis have a 1:1 red green color ratio between the test and reference DNA samples. The region where the purple and green bars overlap (blue) indicates their common region of deletion (i.e., the critical region). The panel on the left shows the whole chromosome 18 view of the data. The panel on the right shows a zoomed in view of the critical region; from position 69.2 to 78.4 Mb. The locations of the genes in that region are shown between the megabase scale and the data points.

