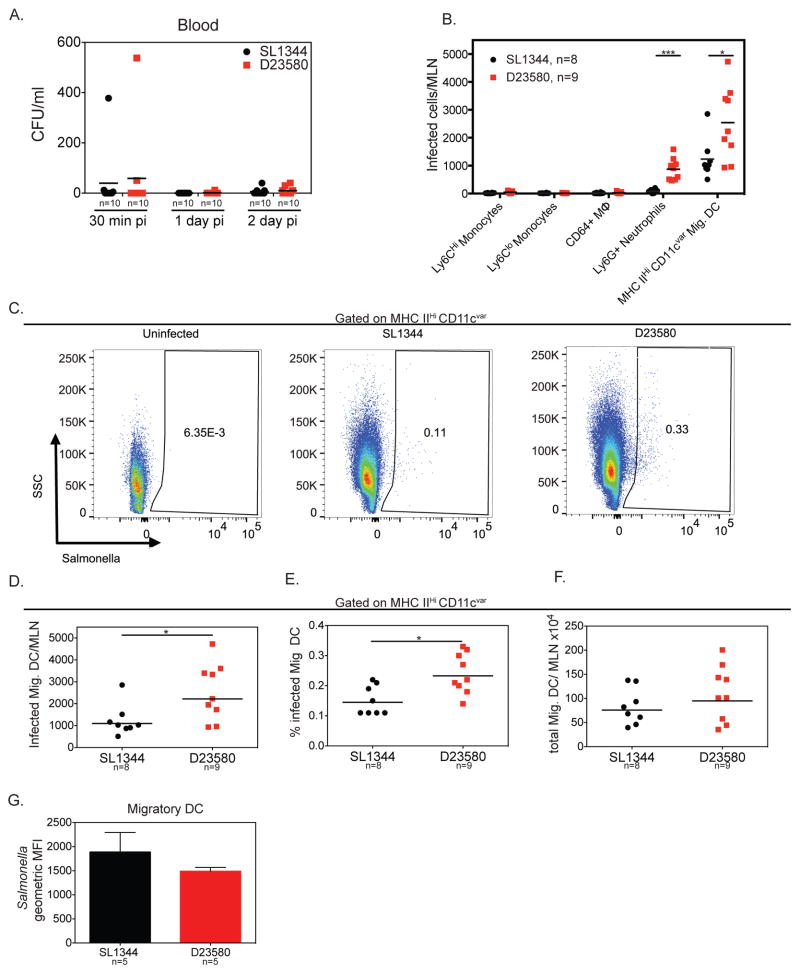
Figure 2. Higher levels of Migratory DC are infected by ST313 S. Typhimurium isolate in the MLN.
(A) Streptomycin-pretreated C57BL/6 mice were orally infected and mice were sacrificed at 30 minutes, 1 and 2 dpi. CFU/ml in the blood was enumerated by plating. (B–F) Mice were infected as in A and sacrificed 2 dpi. Single cell suspensions of MLN were stained for cell surface markers and intracellular Salmonella and analyzed by flow cytometry. Salmonella was detected using the anti-Salmonella antibody CSA-1-FITC. (B) The total number of Salmonella-infected cells per MLN for innate immune cell types are presented. (C) Representative pseudocolor dot plots showing the percentage of Salmonella-infected migratory DC are given for uninfected, ST19 SL1344-infected and ST313 D23580-infected mice. (D) Total number of Salmonella-infected migDCs per MLN are shown for ST19 SL1344- and ST313 D23580-infected mice. (E) Percentage of Salmonella-infected migDC was calculated as the percent of total migratory DC that were infected. (F) Total number of migDC per MLN from SL1344- and D23580-infected mice are presented. (A–F) Data presented are the combination of 2 independent experiments with 4–5 mice per group. The geometric mean for each group is shown. Statistical significance was determined by the Mann-Whitney test. (G) Geometric mean fluorescence intensity (MFI) for infected migDCs from a representative experiment with 5 mice per group is presented. Experiment was repeated at least two times. The mean and standard deviation are shown. Statistical significance was determined by unpaired t-test with Welch’s correction. * P≤0.05, ** P≤0.01, *** P≤0.001. See also Figures S1–4.

