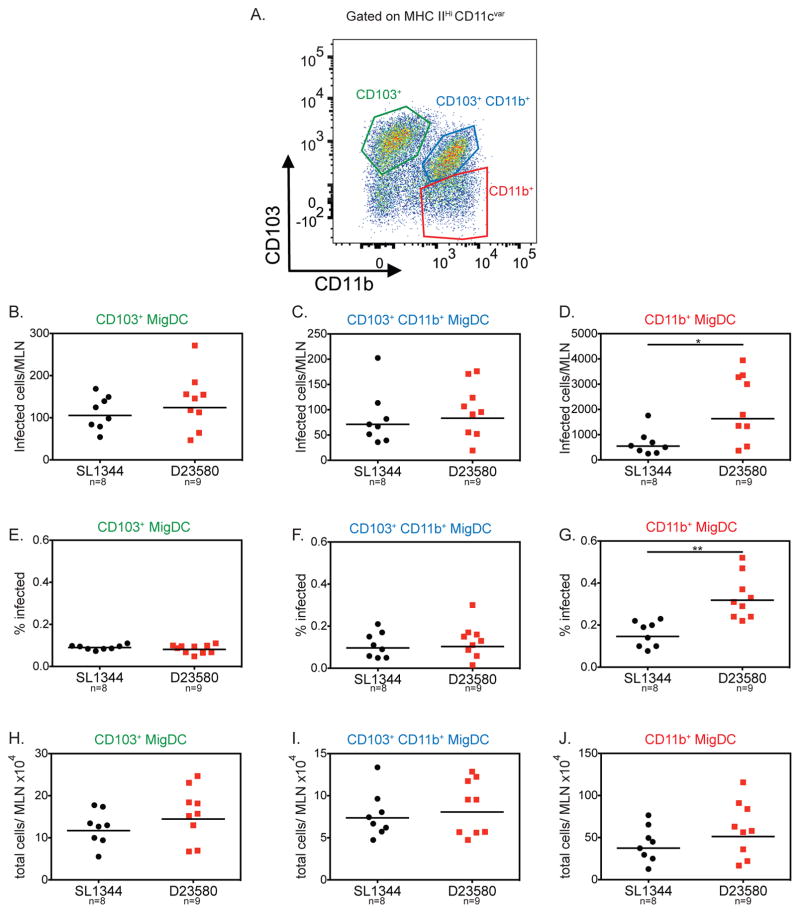
Figure 4. ST313 S. Typhimurium infects higher numbers of CD11b+ migratory DCs.
Streptomycin-pretreated C57BL/6 mice were orally infected and mice were sacrificed 2 dpi. Single cell suspensions of the MLN were stained for cell surface markers and intracellular Salmonella. A representative flow cytometry plot of the migratory dendritic cell subsets of the MLN is presented in (A). The total number of infected cells per MLN (B–D), percent of each subset infected (E–G) and total number of cells recruited to the MLN (H–J) are shown for the three migDC subsets. (B–J) Data presented are the combination of 2 independent experiments with 4–5 mice per group. The geometric mean for each group is shown and statistical significance was determined by the Mann-Whitney test. * P≤0.05, ** P≤0.01.

