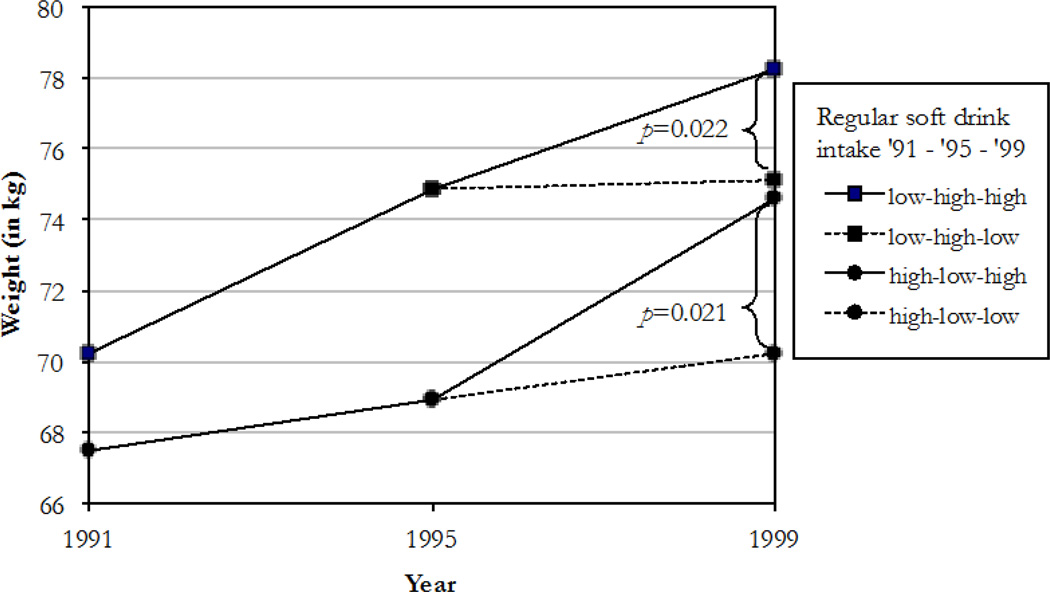
Figure 1.
Mean weight in 1991, 1995, and 1999 according to trends in sugar-sweetened soft drink consumption in 1,969 women who changed consumption between 1991 and 1995 and either changed or maintained level of consumption until 1999*
* Low and high intakes were defined as ≤1/week and ≥1/day. The number of subjects were: low-high-high=323, low-high-low=461, high-low-high=110, and high-low-low=746. Groups with similar intake in 1991 and 1995 were combined for estimates for these time points. Means were adjusted for age, alcohol intake, physical activity, smoking, postmenopausal hormone use, oral contraceptive use, cereal fiber intake, and total fat intake at each time point. From reference 21.

