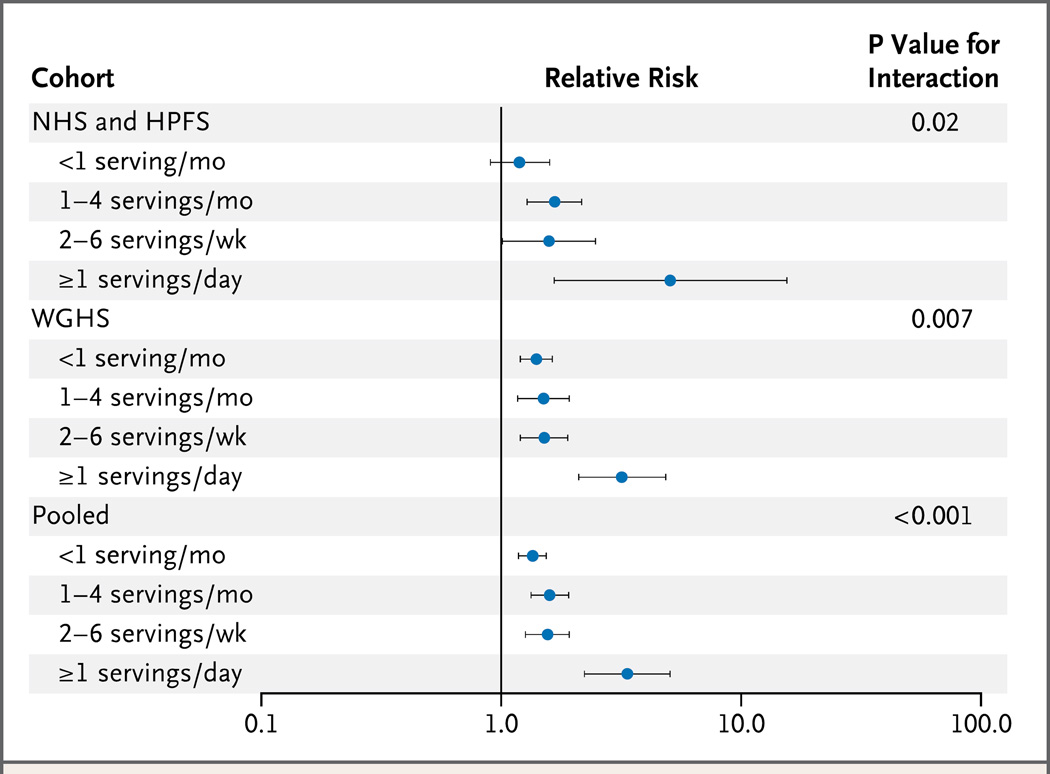
Figure 2.
Relative Risk of the Development of Obesity per Increment of 10 Risk Alleles, According to Intake of Sugar-Sweetened Beverages
For the discovery phase, with data from the Nurses’ Health Study (NHS) and Health Professionals Follow-up Study (HPFS) cohorts, the analyses were based on 18 years of follow-up for 6402 initially nonobese women (1980 to 1998, 1107 incident cases of obesity) and 12 years of follow-up for 3889 initially nonobese men (1986 to 1998, 297 incident cases of obesity). Shown are the pooled relative risks of incident obesity, with adjustment for age, source of genotyping data, level of physical activity, status with respect to current smoking, alcohol intake, time spent watching television, Alternative Healthy Eating Index score, and total energy intake. For the replication phase, with data from the Women’s Genome Health Study (WGHS) cohort, the analyses were based on a median of 6 years of follow-up for 18,127 initially nonobese women (1992 to 1998, 2280 incident cases of obesity). Shown are the relative risks of incident obesity, with adjustment for age, geographic region, eigenvectors, level of physical activity, status with respect to current smoking, alcohol intake, and total energy intake. Horizontal bars indicate 95% confidence intervals.
From: Qi Q, Chu AY, Kang JH, Jensen MK, Curhan GC, Pasquale LR, et al. Sugar-sweetened beverages and genetic risk of obesity. The New England journal of medicine. 2012; 367: 1387–96.

