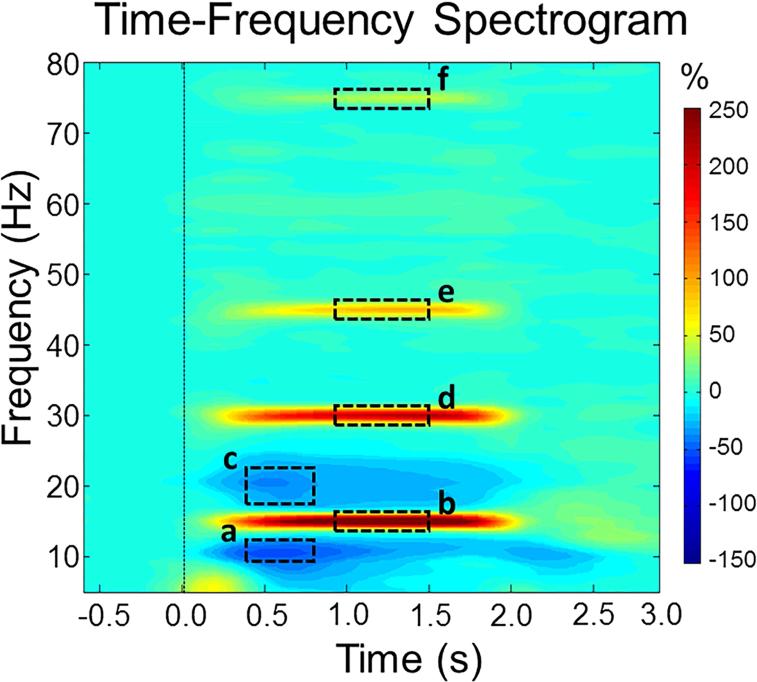
Figure 1. Group-averaged time-frequency spectra during visual entrainment.
Time (s) is denoted on the x-axis, with 0.0 s defined as stimulus onset. Frequency (Hz) is shown on the y-axis. All signal power data is expressed as a percent difference from baseline, with the color legend shown to the far right. The baseline was defined as −0.6 to 0.0 s before stimulus onset. Data represent a group-averaged gradiometer near the medial occipital cortex averaged across all participants (the same sensor was selected in each participant) in the active and sham groups. As can be discerned, the visual flicker stimulus resulted in entrainment at the fundamental frequency (15 Hz), as well as the second harmonic (30 Hz), third harmonic (45 Hz), and fifth harmonic (75 Hz). Significant entrainment was unable to be resolved at 60 Hz, likely because this is the mains power frequency in the United States. There were also significant desynchronization responses found in the alpha and beta frequencies. Dotted boxes denote the time-frequency bins that were imaged using beamforming for the a) alpha ERD, b) fundamental, c) beta ERD, d) second harmonic, e) third harmonic, and f) fifth harmonic.

