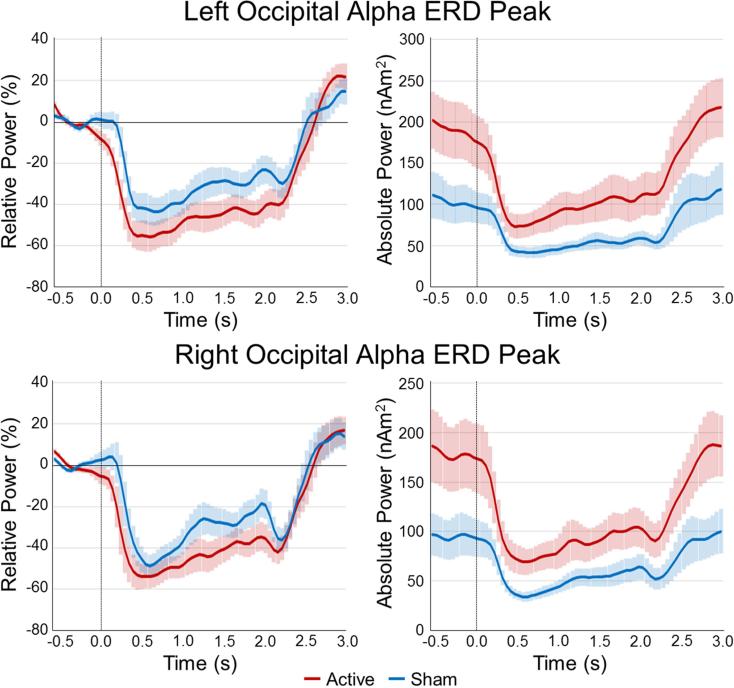
Figure 5. Absolute and relative temporal evolution of the alpha visual response.
Voxel time series were extracted from the peak voxels of the left occipital cortex (top panel) and right occipital cortex (bottom panel) to more precisely examine the dynamics of the alpha ERD in the active (red line) and sham groups (blue line). Time (in s, stimulus onset = 0.0 s) is denoted on the x-axis, while power is shown on the y-axis. The left panel shows each response as a percentage relative to baseline (−0.6 to 0.0 s), while the right panel shows the absolute power (in nAm2). Participants in the active group had significantly stronger basal alpha power (p < .001, corrected), but this did not impact task-induced oscillatory alpha responses (relative to baseline). The shaded area around each line denotes the SEM.

