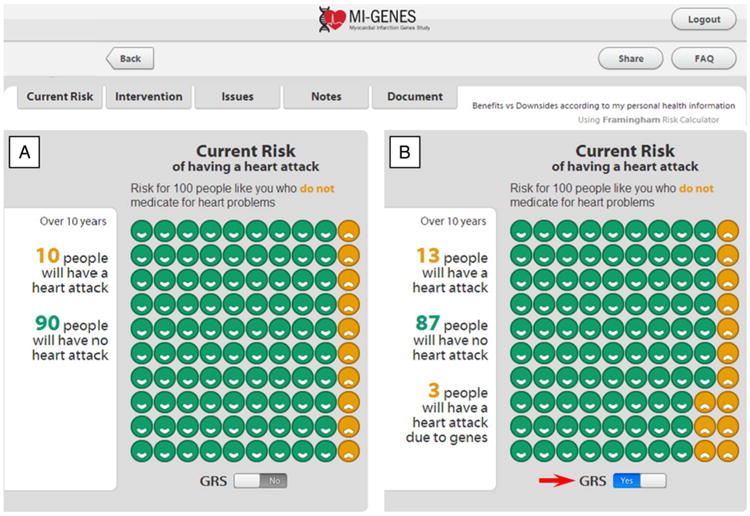
Figure 2.

Disclosure of CHD risk. Disclosure of CHD risk estimates based on the CRS (panel A) and after implementing the genetic risk score (CRS*GRS, panel B) by clicking on the GRS button (arrow). In this example, the patient's 10-year CHD risk based on CRS is displayed as 10% (A). With a GRS of 1.3, the overall risk increases to 13% as shown in (B). CHD, coronary heart disease; CRS, conventional risk score; GRS, genetic risk score; MI-GENES, Myocardial Infarction GENES.
