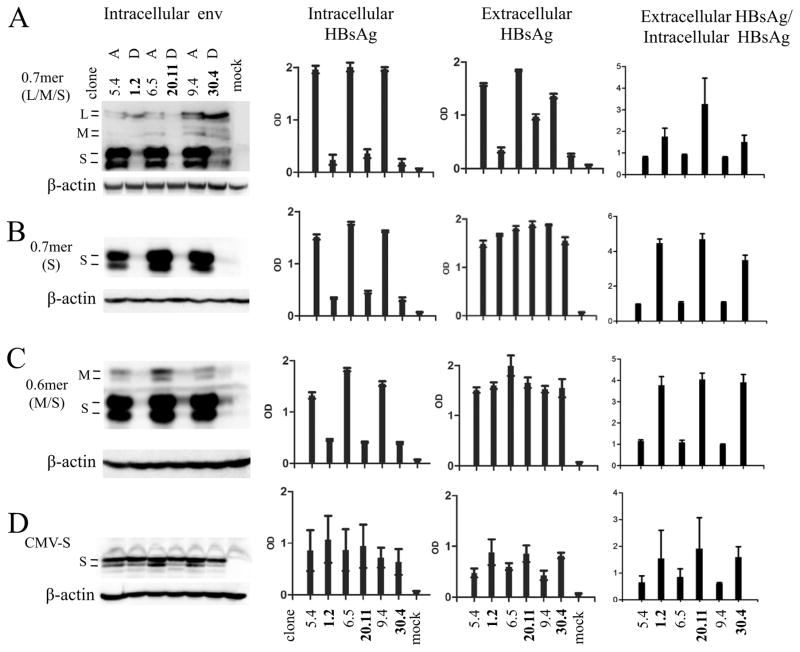
Fig 6.
Comparison of intracellular and extracellular levels of HBsAg produced by various forms of subgenomic constructs of genotype A vs. genotype D. Three clones each of genotype A (5.4, 6.5, and 9.4) and genotype D (1.2, 20.11, and 30.4) were examined. (A) 0.7mer construct for L, M, and S proteins. (B) 0.7mer construct unable to express L and M proteins due to a stop codon in the preS2 region. (C) 0.6mer construct for M and S proteins. (D) CMV-S construct for the S protein. These constructs were transiently transfected to Huh7 cells. Shown on the left is Western blot analysis of intracellular envelope proteins. The next two panels show ELISA results of intracellular HBsAg (1:200 dilution for CMV-S construct, and 1:400 dilution for other constructs) and extracellular HBsAg (0.7mer:1:200 dilution; 0.6mer:1:150 dilution; CMV-S:1:100 dilution), respectively. The right panels are calculated ratio of extracellular HBsAg/intracellular HBsAg. ELISA data are based on 6 independent transfection experiments.

