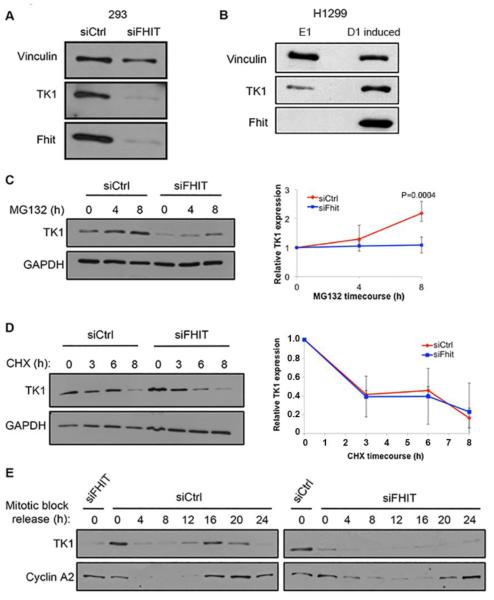
Fig. 1. S-phase specific TK1 protein synthesis in Fhit-positive and negative cells.
A. Immunoblot of Vinculin, TK1, and Fhit in 293 cells 72 h post transfection with siCtrl and siFHIT. B. Immunoblot of Vinculin, TK1, and Fhit in H1299 E1 and D1 induced cells. Cells were harvested 48 h after treatment with ponasterone A. C. Immunoblot of TK1 and GAPDH in siRNA transfected 293 cells treated for indicated times with 10 μM MG132 (left panel). Relative TK1 protein expression determined by densitometric analysis of the immunoblots (right panel). D. Immunoblot of TK1 and GAPDH in siRNA transfected 293 cells treated for indicated times with 100 μg/ml cycloheximide (CHX) (left panel). Protein lysates from siFHIT cells were loaded at 2:1 ratio compared to siCtrl lysates to more accurately measure rate of degradation. Relative TK1 protein expression determined by densitometric analysis of immunoblots (right panel). E. Immunoblot of TK1 and Cyclin A2 in siRNA transfected 293 cells synchronized by thymidine/nocodazole block and released for up to 24 h. Cells pass through S and G2 phases between 16-24 h after release as determined by Cyclin A2 expression. The initial ‘0’ lanes on the two blots show siFHIT and siCtrl lanes for direct comparison to the juxtaposed ‘0’ lanes for the siCtrl and siFHIT time-course immunoblots of TK1 and Cyclin A2 expression. Error bars indicate standard deviation.

