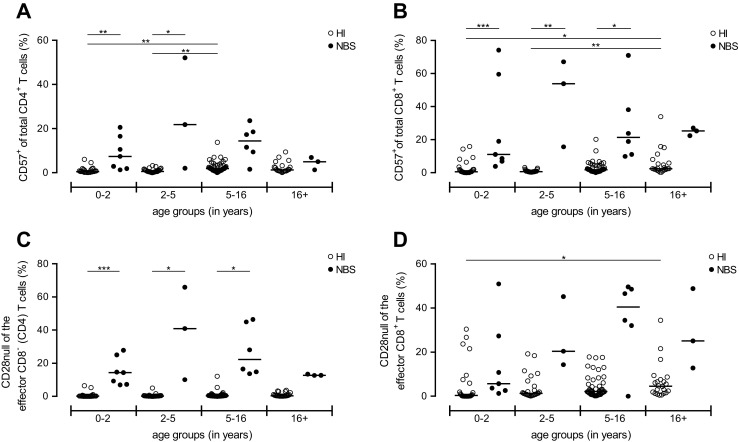
Fig. 5.

Frequency CD28null and CD57-expressing T cells. Frequencies of peripheral CD57+ cells within the CD4+ (a) and CD8+ (b) T cells were determined in both NBS patients (n = 20, black dots) and HI (n = 125, open dots). Next, the loss of co-stimulatory molecule CD28 within the effector fraction (CD45RO−CD197−) of the CD8− (CD4) (c) and CD8+ (d) T cell population was determined. Both groups were divided on the basis of their age into four groups (age distribution (n = HI vs. NBS), respectively): 0–2 (n = 26 vs. 7), 2–5 (n = 27 vs. 3), 5–16 (n = 50 vs. 6), and 16+ years old (n = 22 vs. 3). Data represents individual measurements and medians. Significant differences between patients and HI and between different age groups were calculated and shown (* = p < 0.05, ** = p < 0.01, *** = p < 0.001)
