Figure 1.
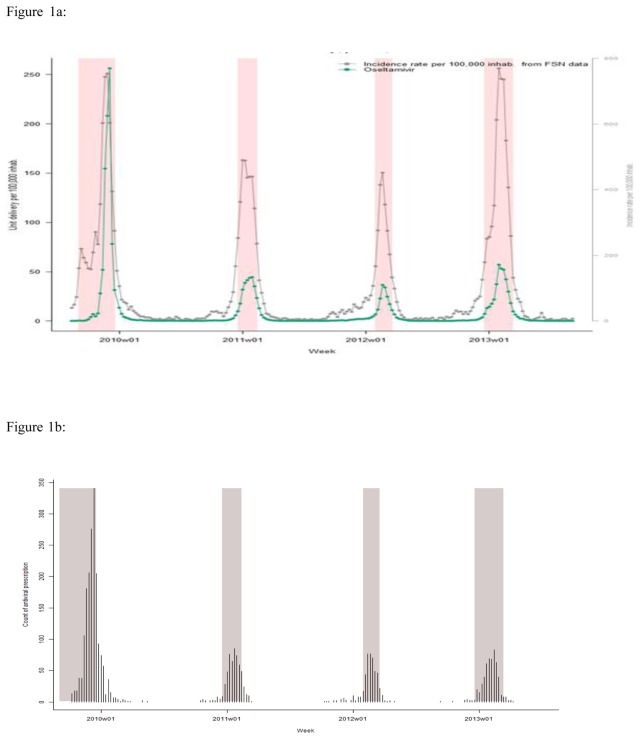
Figure 1a: Number of boxes of oseltamivir delivered per 100 000 inhabitants per week in France between 2009 and 2013, weekly incidence of ILI cases seen in general practice.
* Shaded periods represent influenza epidemic periods determined by applying a periodic regression model on weekly ILI incidence rates below a cut-off value [1]
Figure 1b: Number of cases included in the study who received a NIs’ prescription in and outside of the influenza epidemic periods in the Sentinel GPs database.
* Shaded periods represent influenza epidemic periods determined by applying a periodic regression model on weekly ILI incidence rates below a cut-off value [1]

