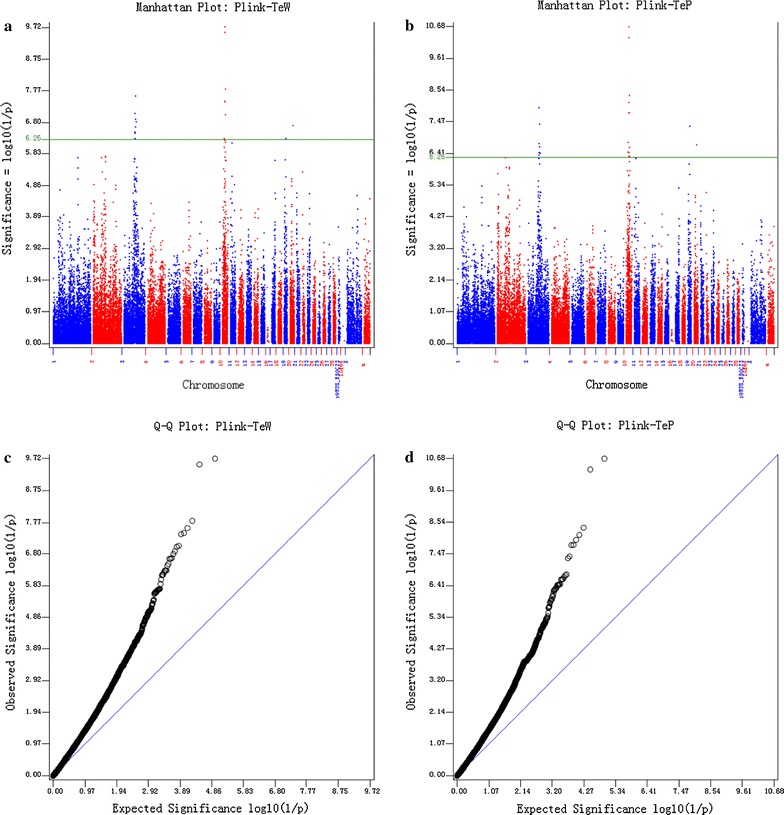
Fig. 3.

Results of genome-wide association studies using PLINK. The results are presented as Manhattan plots in the top panels (a, b) and Q–Q plots in the bottom panels (c, d). The left panels show the results for testis weight (TeW) and the right panels for testis percentage of body weight (TeP). The solid line indicates the Bonferroni threshold for multiple test correction with a type I error of 5% (P value <5.48 × 10⁻⁷)
