Fig. 4.

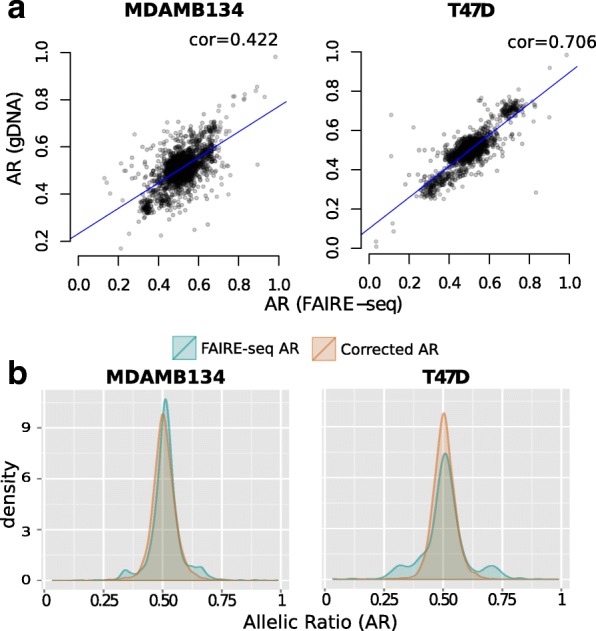
ASB detection from FAIRE targeted sequencing data. a Correlations between the allelic ratios obtained from gDNA and FAIRE-seq data. b Density plots showing the distribution of allelic ratios before (green) and after (orange) BaalChIP correction. The adjusted AR values were estimated by the BaalChIP model after taking into account the RAF scores computed directly from the control gDNA samples. AR allelic ratio, ASB allelic-specific binding, cor correlation, gDNA genomic DNA, RAF reference-allele frequency
