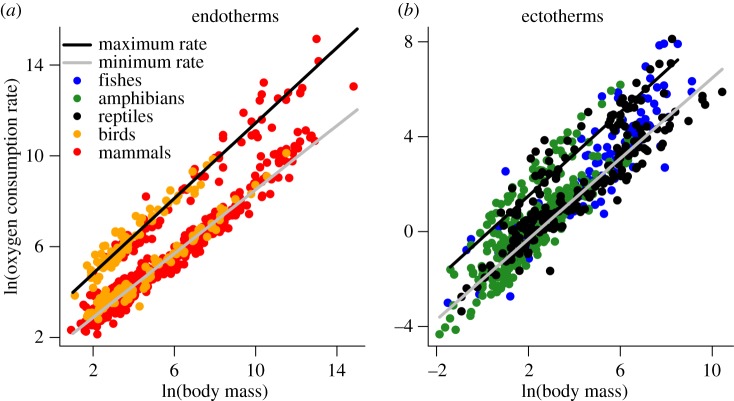
Figure 1.
(a,b) Relationships of maximum and resting oxygen consumption rates to body mass (g) in (a) endotherms (birds and mammals) and (b) ectotherms (fishes, amphibians, and reptiles) based on OLS regression analyses (see table 1 for statistics, including results of PGLS regression analyses). Oxygen consumption rates (ml O2 h−1) are normalized to 38°C in endotherms, and 25°C in ectotherms by assuming a Q10 of 2.

