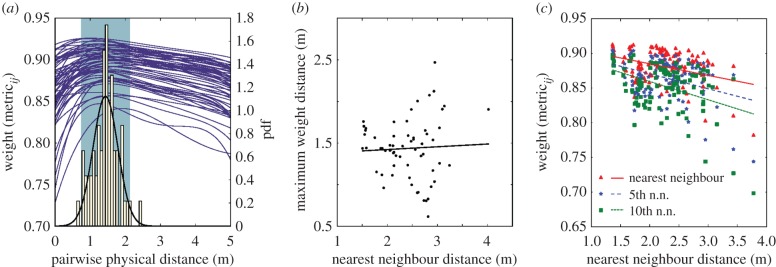
Figure 3.
(a) Blue lines correspond to the left axis and are the smoothed average relationship between pairwise physical distance and heading similarity for all birds in 62 frames pulled randomly from the four time slices. Smoothing was by spline with a local standard deviation tolerance. The right axis shows the probability density scale for the histogram of maximum weight distances and its fitted normal distribution (μ = 1.435183, σ = 0.354939)  wingspan; normality was confirmed with an Anderson–Darling test (test statistic 0.313587, p > 0.15, null hypothesis of normality). The shaded region is the 95% CI for the mean. (b) The maximum weight pairwise distance did not vary with mean nearest neighbour distance (R2 = 0.002315, p = 0.710362). However, as shown by the trend lines in (c), the average weight of the nth neighbour decreased with increases in nearest neighbour distance, (R = −0.353969, −0.378956, −0.394210 for the nearest, 5th nearest, and 10th nearest neighbours, respectively; p = 0.000112, 3.21440 ×10⁻⁵, and 1.42674 ×10⁻⁵). As expected, average weight also declined with neighbour index. Data in (c) were computed from 114 samples of 100 consecutive frames across the full dataset.

