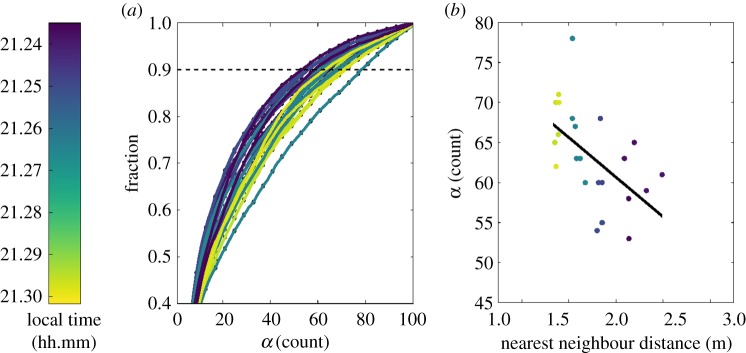
Figure 4.
Scaling of group sizes within the flock dendrogram. Panel (a) shows the summed transition probabilities reaching group size α computed for 24 different temporally close samples of dendrograms gathered from regions of 65 consecutive frames in all four time slices. Panel (b) shows a linear fit to the highest integer α such that the summed transition probabilities are <0.9, R = −0.540670, p = 0.006375; the fit produced residuals with an estimated mean μ = 1.421085 × 10⁻¹⁴ and an Anderson–Darling test for normality was performed which yielded a statistic of 0.268692,  (null hypothesis of normality).

