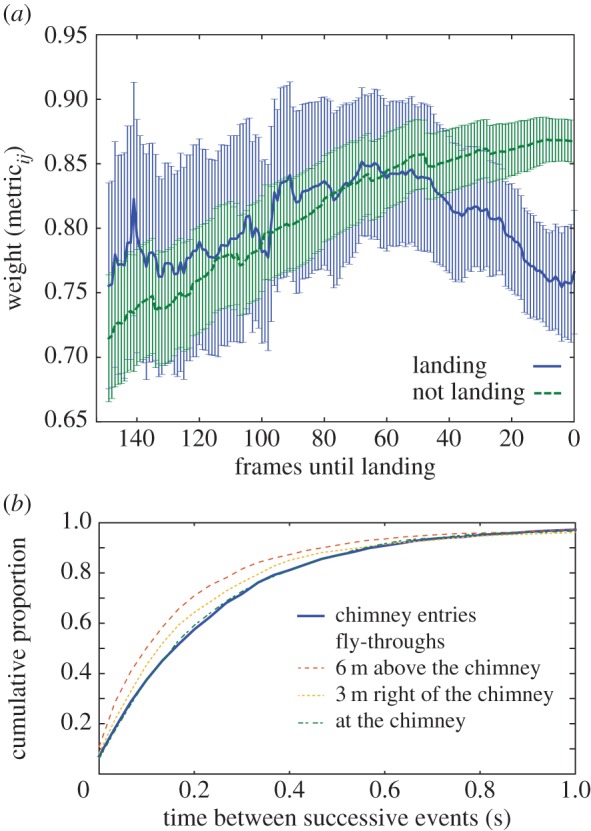
Figure 6.

Properties of birds at landing. (a) Compares the network weights of pairs Wij of landing and non-landing birds through time. Pairs either land or, for non-landing birds, enter a control volume 6 m above the chimney within 10 video frames of one another. Lines show the mean and 95% CIs; n = 65 pairs for landing and 171 for non-landing. Panel (b) shows the cumulative distribution of time intervals between successive landing events or birds flying through three different control regions. In this case, the volume of the control region target was adjusted to give equal number of individuals in all landing and non-landing cases. All results are from the last time slice, which contains the majority of landing events observed (figure 2).
