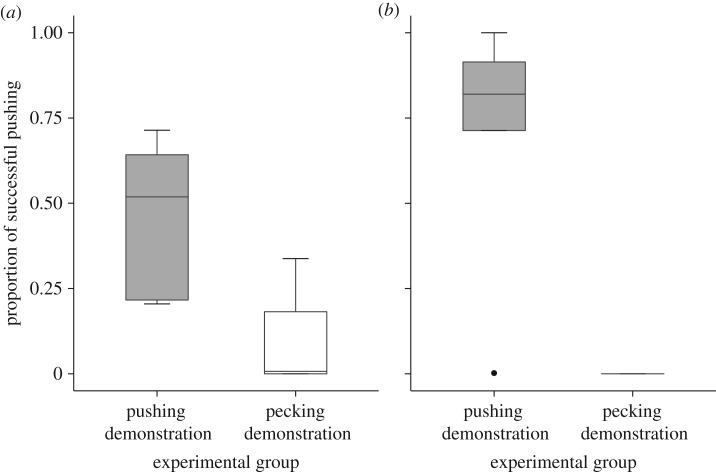
Figure 2.
The proportion of successful pushing performed during the test phase (out of the total number of successful actions performed by a fledgling) in the ‘pushing demonstration’ group (grey) and ‘pecking demonstration’ group (white). (a) Fledglings raised in the first cohort (pushing demonstration group: n = 5, pecking demonstration group: n = 6). (b) Fledglings raised in the second cohort (pushing demonstration group: n = 5, pecking demonstration group: n = 2). Data are represented as median ± quantiles. Note that as there were only two types of successful actions performed, the proportion of pushing is a relative measure, reciprocal to the proportion of pecking.

