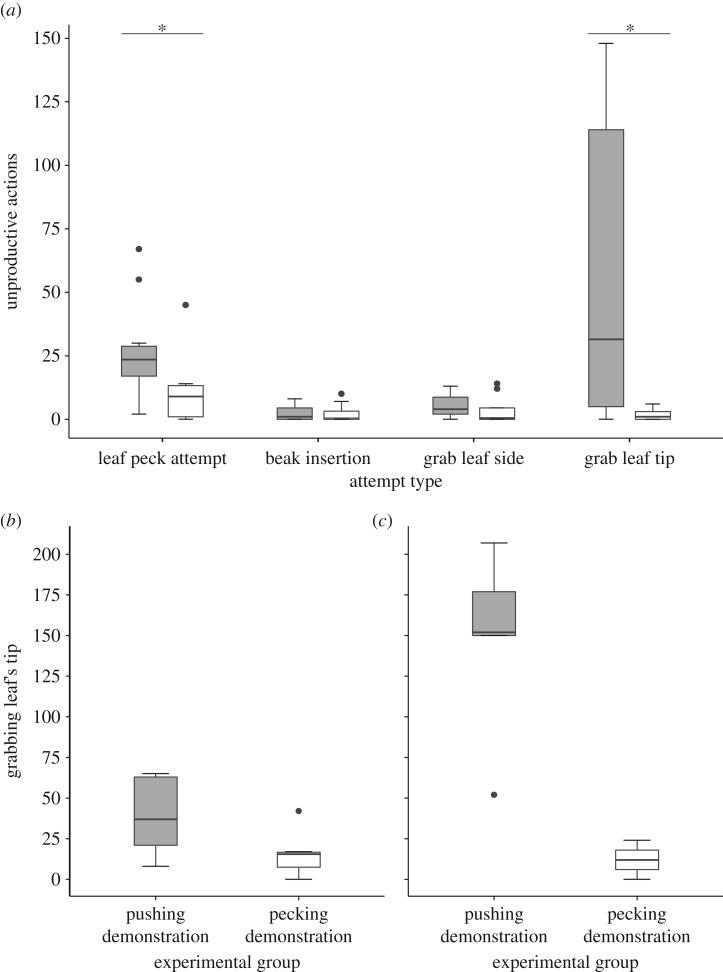
Figure 3.
Unproductive actions performed by fledglings of the ‘pushing demonstration’ group (grey) and ‘pecking demonstration’ group (white) in the test phase. (a) The distribution of different types of unproductive actions. (b) The amount of grabbing of the leaf tip performed by fledglings of the first cohort. (c) The amount of grabbing performed by fledglings of the second cohort. Sample sizes for the pushing and pecking groups of the first and second cohorts were 5 versus 6 and 5 versus 2, respectively. Data are represented as median ± quantiles.

