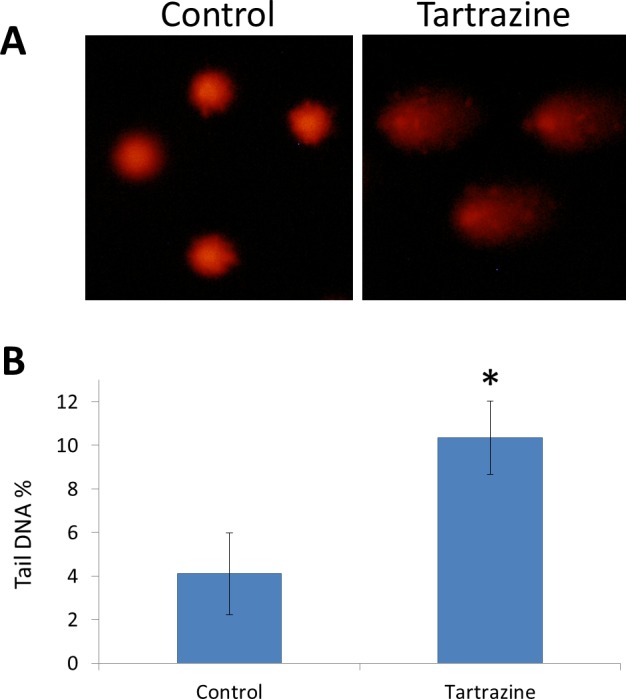
Figure 3. The genotoxic effect of tartrazine on leucocytes of rats.

(A) Fluorescence micrograph representing nuclei of leucocytes after the comet assay. Control nuclei of untreated animals appear intact with no detectable DNA damage. Nuclei of tartrazine-treated animals appear damaged. (B) Bar graph showing the tail DNA damage in percentage in nuclei of leucocytes of control and tartrazine-treated animals subjected to comet assay. Data are Mean ± SD (n = 3, t-test, ∗p < 0.05).
