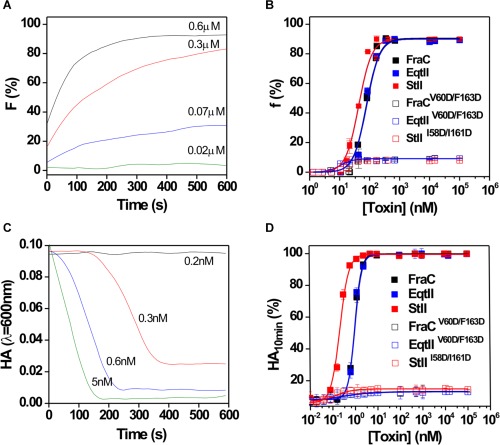
Figure 7.

Permeabilizing and hemolytic activity of wildtype proteins and their mutants. (A) Time course of vesiclepermeabilization induced by FraC. (B) Fraction of vesicles in which at least one pore was formed (f) as a function of initial toxin concentration; f was calculated using eq. (2) at 10 min after toxin addition. Buffer: TBS, lipid composition: PC:SM (50:50), lipid concentration: 10 μM. (C) Time course of the lysis of the red blood cells promoted by FraC. (D) Dose‐dependence curve of the lysys of red blood cell after 10 min of assay (AH10 min). The time course of hemolysis was followed by the decrease in turbidity of a cell suspension initially adjusted to an apparent absorbance of 0.1 at 600 nm. Buffer: TBS, cell concentration: 105 cell mL−1. Curves in B and D were fitted to a Hill function using Origin 8.0, Microcal (USA). Experiments were done in triplicate (R 2 > 0.99).
