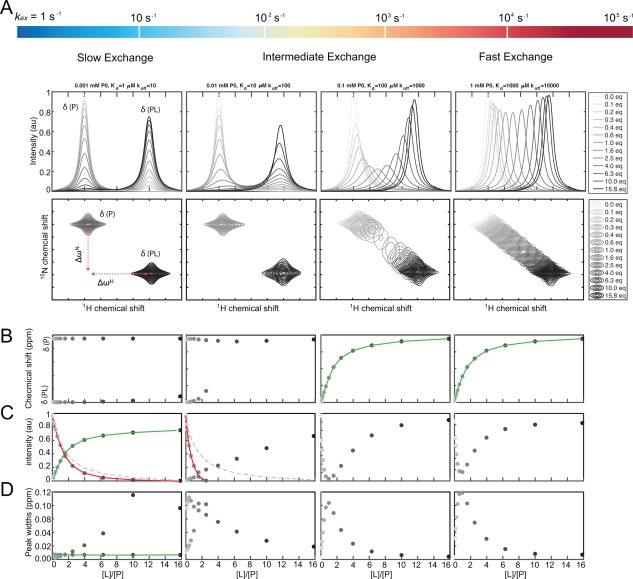
Figure 3.

NMR quantification of binding events occurring in different exchange regimes. A) 1D (top) and 2D (bottom) spectra of a protein titrated with a ligand ranging from 0 (light grey) to 15.8 (black) molar equivalents of ligand compared to the initial free protein concentration. Changing the exchange rate (kex) from slow to fast (left to right) compared to the difference in resonance between the free and bound states, Δω, changes the appearance of the spectra. In the slow exchange regime (left), the quantification will rely on either the peak intensities of the unbound protein or of the protein–ligand complex. In the fast exchange regime (right), the chemical shift of the observed peak will be a weighted average of the population of the two states, and thus, the binding constant can be readily determined from the chemical shift. In this case, quantification is feasible in both dimensions, and is often expressed as a normalized Euclidian distance between the different states (see text). B‐D) The extractable parameters obtainable from the spectra during the ligand titration: (B) The chemical shift in ppm or Hz; (C) the normalized intensity of the NMR peak in arbitrary units, and (D) the NMR peak width at half height measured in ppm or Hz. The solid green lines indicate when reliable binding constants can be extracted from fitting the observed parameter, the solid red lines indicate false estimates of the binding constant and the grey dashed lines show the correct calculated binding curve for the red lines.
