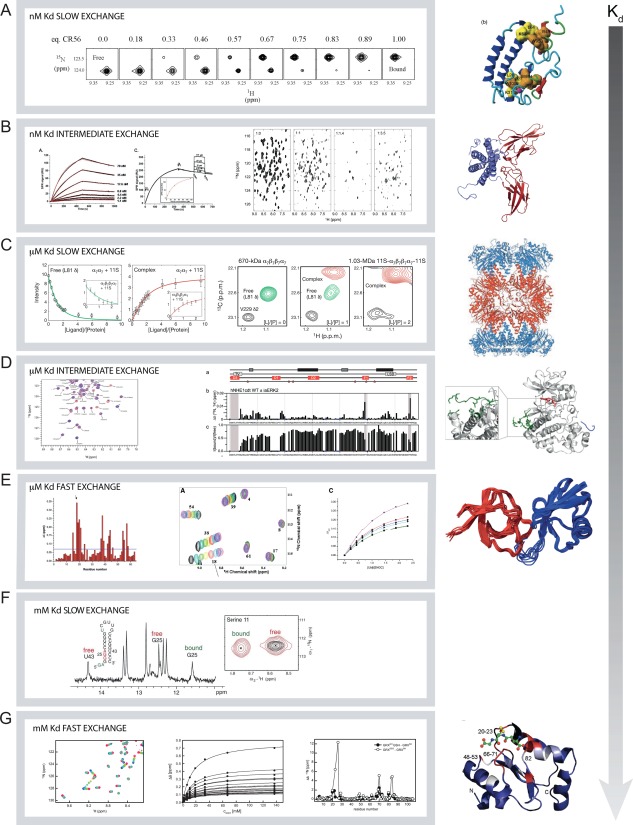
Figure 5.

Examples of protein–ligand interactions studied by NMR spectroscopy. Seven different examples are shown with difference in exchange rates and binding affinities. A) Binding of CR56 to 15N‐RAP (PDB 2FYL) where the affinity is in the nM range and the process in slow exchange.68 The NMR spectra are extracts from 15N,1H‐HSQC spectra and the peak from the free state of Glu40 is disappearing and the peak from the bound state is appearing. Figure modified and reprinted from reference (68), copyright (2006), with permission from Elsevier. B) Binding of prolactin to the extracellular domain of the prolactin receptor measured by SPR70 (left) and by 15N,1H‐HSQC NMR spectra69 (right) (PDB 1RW5, 3NPZ). The spectra show the free prolactin (1:0) and with increasing molar amount of the extracellular domain of the prolactin receptor. Figures are reproduced from reference (70, left) and reference (69, right) with permission. Copyright (2007), The American Society for Biochemistry and Molecular Biology, and copyright (2005) Oxford University Press, respectively. C) Formation of the MDa complex between the 20S proteasome and the 11S activation domain which is in slow exchange and has μM affinity.54 Peaks from both the free and the bound states of 13C‐methyl labelled 20S proteasome are observed in the methyl TROSY spectra. Reprinted by permission from Macmillan Publishers: Nature (reference 54), copyright (2007). D) Interaction between the intrinsically disordered C‐terminal tail of NHE1 with ERK2 where the binding process is in the intermediate exchange regime and with μM affinity. Extract from the HSQC NMR spectra (left) where peaks disappear and mapping of change in peak intensities in these spectra as a function of residues shown as the ration between the free and bound states.71 Grey shaded areas indicate the three interaction sites. The three lines a) show the position of the transient helices in the disordered regions, and in red the possible kinase docking sites. Stars indicate potential ERK2 phosphorylation sites. Reproduced with permission from (71), copyright (2016) Springer Nature. E) Binding in the fast exchange regime with μM affinity between the SH3 domain of CD2 associated protein (CD2‐AP) with ubiquitin.72 To the left is shown the combined chemical shift changes pr. residue, the middle show the individual spectra of the titration and c) the determination of Kd from fits to the change in chemical shifts. Figure is reproduced from (72), copyright (2013) PLOS. F) Slow and weak binding of a GGA motif in the stem of an RNA hairpin to the protein RsmE from P. fluorescens. Peaks from both RNA (1D 1H‐spectra) and protein (2D 1H,15N‐HSQC spectra) in the free and bound states are observable74. Figure reproduced from (74) with permission. Copyright (2014), Oxford University Press. G) Interaction with glutathion with glutaredoxin is weak and the process is in fast exchange. The changes in chemical shifts in the 1H,15N‐HSQC NMR spectra can adequately be fitted to determine a dissociation constant25. Middle and right reproduced, with permission, from reference (25), copyright (2011) American Chemical Society.
