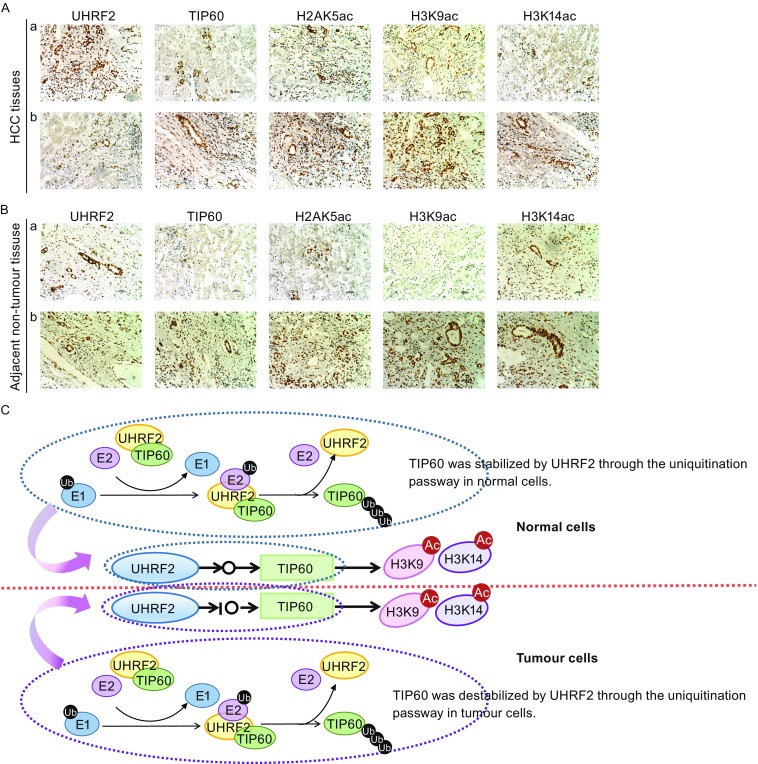
Figure 6.

TIP60 and UHRF2 were negatively correlated in HCC tissues. (A) Immunohistochemistry with indicated antibodies in HCC tissues. UHRF2 showed a high expression in group “a” and low expression in group “b”. (B) Immunohistochemical analysis using the indicated antibodies in adjacent non-tumor tissues. UHRF2 showed a high expression in group “a” and low expression in group “b”. (C) Model of UHRF2-TIP60-H3K9ac and H3K14ac signaling axis
