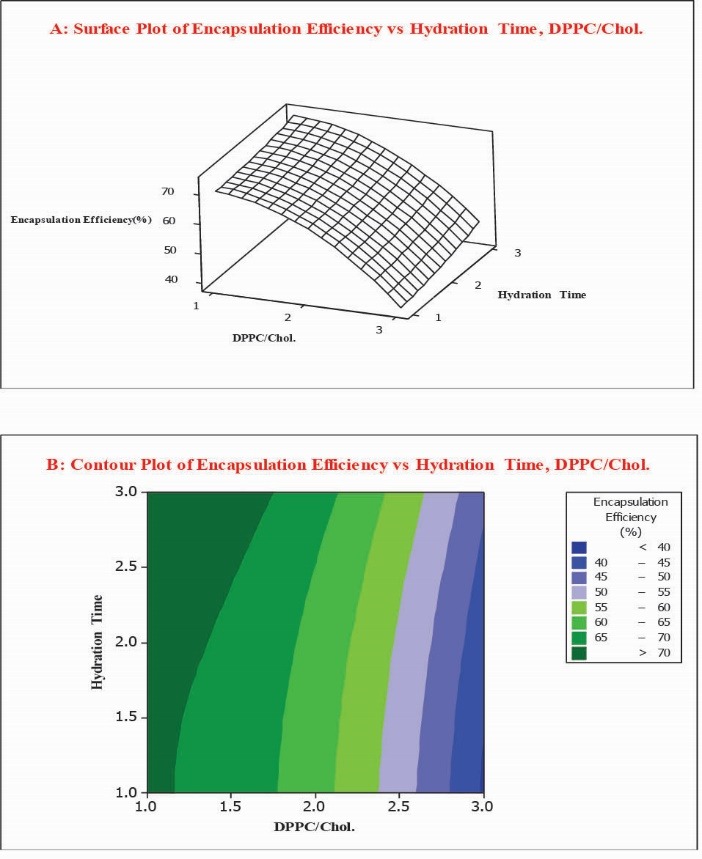
Fig. 2.

Surface plot (A) along with contour plot (B) showing molar ratio of DPPC/Cholesterol and hydration time effects on encapsulation efficiency percent (EE %).

Surface plot (A) along with contour plot (B) showing molar ratio of DPPC/Cholesterol and hydration time effects on encapsulation efficiency percent (EE %).