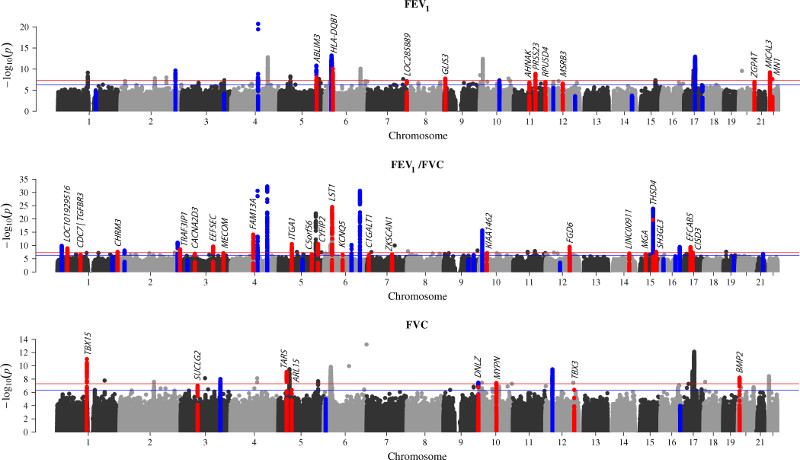
Figure 1.
Manhattan plots of genome-wide association results for FEV1 (top), FEV1/FVC (middle) and FVC (bottom). Previously reported signals are highlighted in dark blue (except signals with P>5x10⁻⁴in this study); and novel signals are coloured in red. Signals are highlighted for the trait with which they showed strongest association only. The red and blue lines correspond to the genome-wide significance level (P=5x10⁻⁸, -log10P=7.3) and the threshold used to select signals for follow up in stage 2 (P=5x10⁻⁷, -log10P=6.3) respectively. Labels show the nearest gene to the novel sentinel variants. There were 2 independent novel signals near CDC7 and TGFBR3 on chromosome 1 (labelled as CDC7/TGFBR3). See Supplementary Table 3 for full results. Image was created using a modified version of the R package qqman.

