
Figure 5.
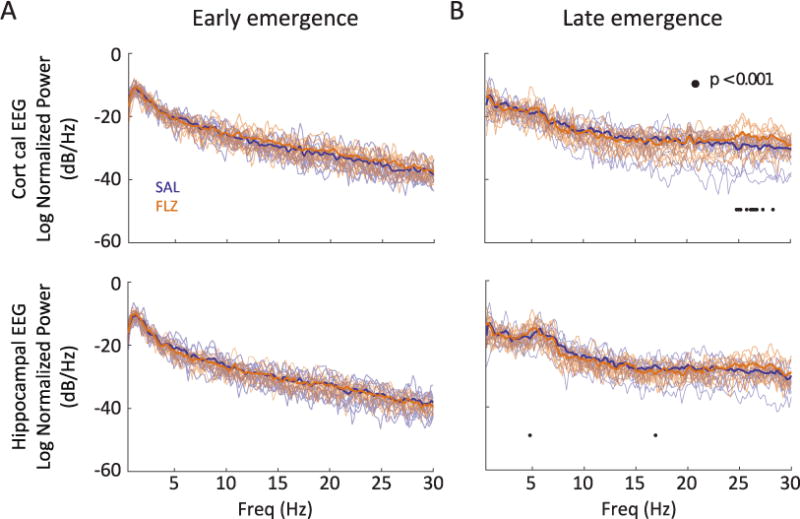
Effect of flumazenil on power spectra during emergence and recovery. Solid lines represent the average normalized power spectral density (PSD) estimates for animals following cessation of anesthesia for early emergence (A) and late emergence (B). Transparent lines designate the raw PSD traces for individual animals in each group. Blue: saline-treated animals; n = 12; Orange: flumazenil-treated animals; n = 12. Significance at p < 0.001 is designated by • as described in Methods section.