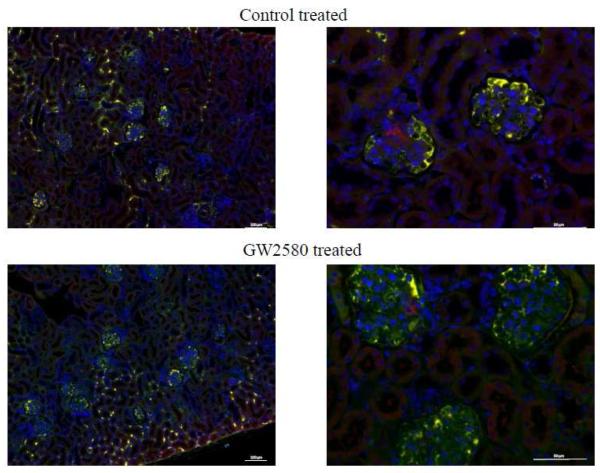
Fig. 3.
Renal IgG and C3 deposition. Kidney sections were stained for IgG deposition (green) and C3 deposition (red). Co-staining of both IgG and C3 appears in yellow. Both control treated and GW2580 treated mice showed similar levels of deposition of both IgG and C3, as seen in these representative images (GW2580 treated, n=6; Control treated, n=6).

