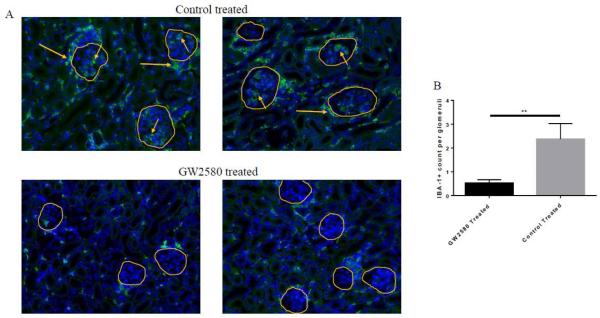
Fig. 4.
IBA-1+ macrophages in the kidney. Kidney sections were stained with the macrophage marker IBA-1 to assess macrophage numbers within the kidney. (A) Control treated mice have more numerous IBA-1+ cells than GW2580 treated mice. Glomeruli are circled in yellow, and are infiltrated by macrophages in the control treated mice (short arrows). Additionally, periglomerular accumulation of macrophages can also be seen in control treated mice (long arrows) (GW2580 treated, n=9; Control treated, n=10) (**p<0.01). Intraglomerular macrophages were quantified in (B) (GW2580 treated, n=7, 73 total glomeruli counted; Control treated, n=9, 91 total glomeruli counted).

