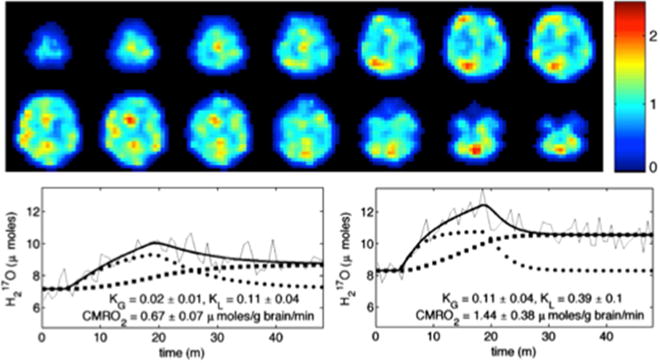
Figure 6.

17O MR based CMRO2 imaging in human brain: CMRO2 maps in mol/g brain/min unit (top) and representative H217O time-courses for single voxels corresponding to low (bottom left, white matter) and high (bottom right, gray matter) metabolic rates. The three-phase metabolic model of water production (thick line) accurately describes the 17O MR data (thin line) to yield CMRO2 values with KG and KL constants shown. Adapted from reference [36]. Copyright © 2010 Elsevier Inc.
