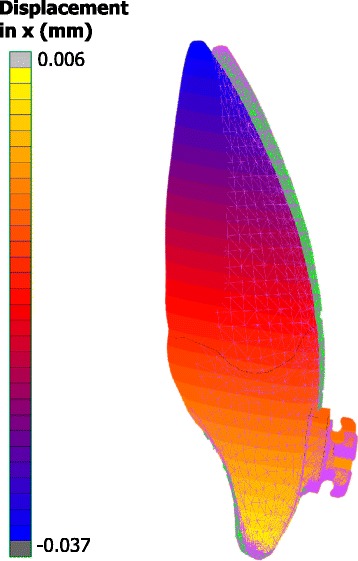
Fig. 3.

Example showing the distribution of calculated displacements in the labiolingual direction. Displacements are magnified optically by 30 at the last increment (tooth with contour bands) to differentiate it from the initial model (tooth with green mesh)
