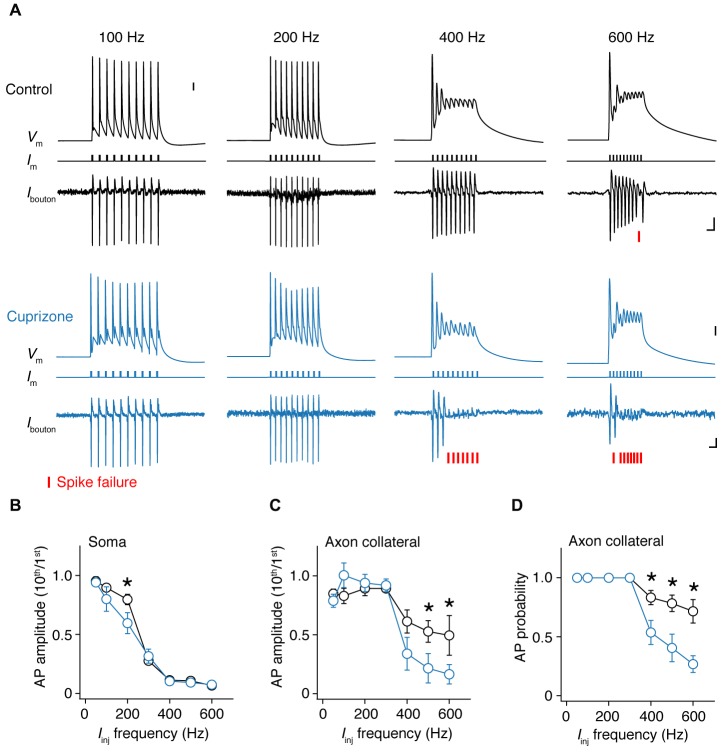
Figure 5.
Frequency-dependent AP failures in presynaptic boutons of demyelinated axons. (A) Simultaneous somatic whole-cell and axonal loose-seal recording from control (black) and demyelinated neurons (blue) during somatic current injections (1 ms pulses) at increasing frequencies. Note the increased failure rate in demyelinated axons. Asterisks, spike failure. Scale bar, 5 ms; 10 mV; 10 pA. Somatic capacitive transients are blanked for clarity reasons. (B) Normalized somatic AP amplitude vs. injected current frequency. t-test, *P = 0.0432. (C) Collateral AP amplitude vs. evoked injected current frequency. M-W test, *P = 0.0446 (500 Hz); *P = 0.0426 (600 Hz). (D) Relationship between AP probability vs. somatic step frequency in control (n = 16 boutons from 16 cells; black open circles) and demyelinated axons (n = 14 boutons from 14 cells; black open circles). Data presented as average ± SEM. M-W test, P = 0.0185 (400 Hz); P = 0.0098 (500 Hz); P = 0.0063 (600 Hz).

