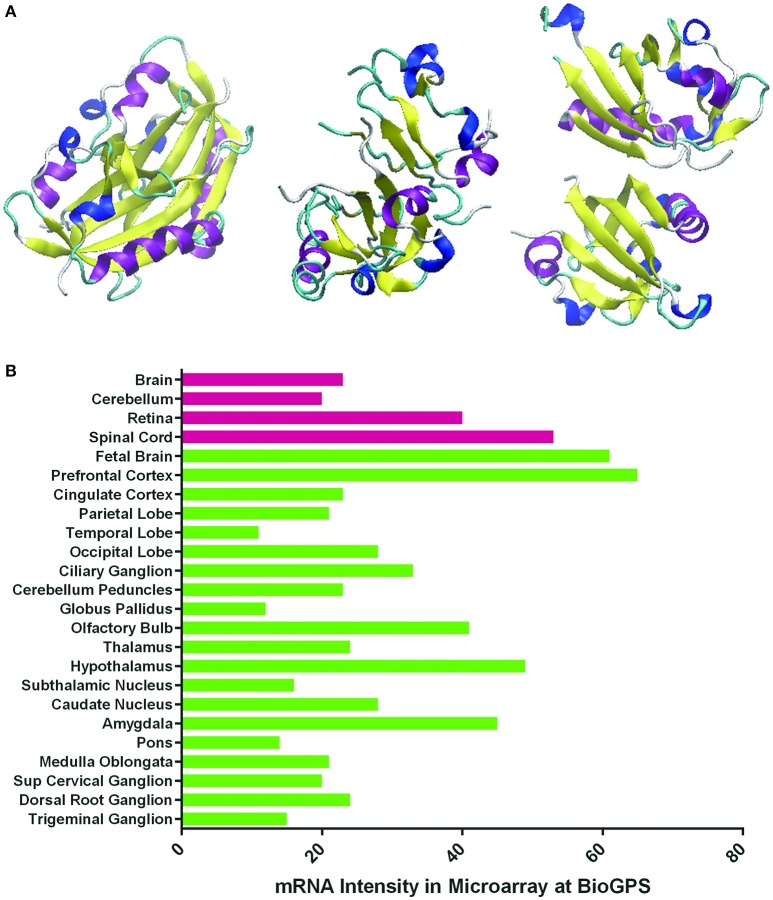
Figure 1.
Three-dimensional structures of HIF's alpha subunits and HIF-1α expression levels in normal human nervous tissues. (A) Schematic representation of the crystal structures of HIF-1α, HIF-2α, and HIF-3α proteins reported at the Protein Data Bank (PDB) with PDB ID 4H6J, 4GHI, and 4WN5, respectively (http://www.rcsb.org/pdb/home/home.do). Different structural parts are highlighted in the following colors: magenta: α-helix; yellow: residue in isolated β-bridge; blue: loop; cyan: hydrogen bounded turn; white: bend. They contain the N-terminus, central region and C-terminus. (B) HIF-1α mRNA expression levels in normal human nervous tissues (normalized intensities in microarray) reported in Genecards (http://www.genecards.org).

