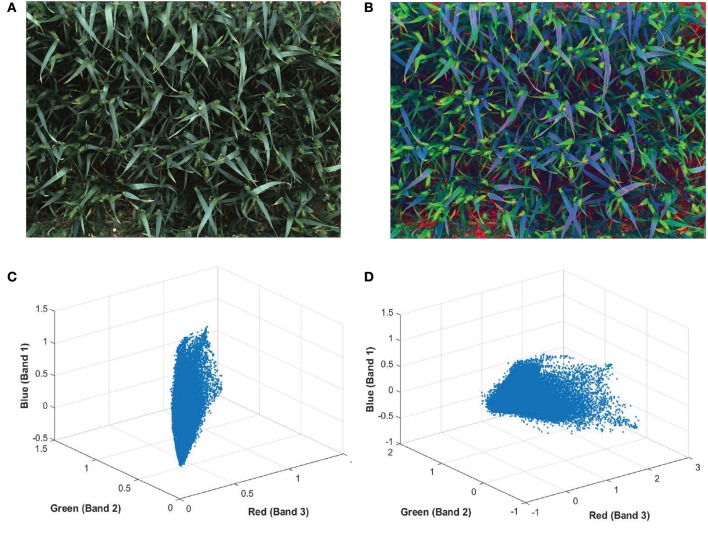
Figure 5.
Digital image of wheat (Triticum aestivum L. cv. Soissons) canopy (A) before and (B) after enhancement of image contrast and application of decorrelation stretching. Scatterplot of every pixels normalized red, green blue (RGB) values from (C) the original image and (D) after applying the decorrelation stretch and contrast increase.

