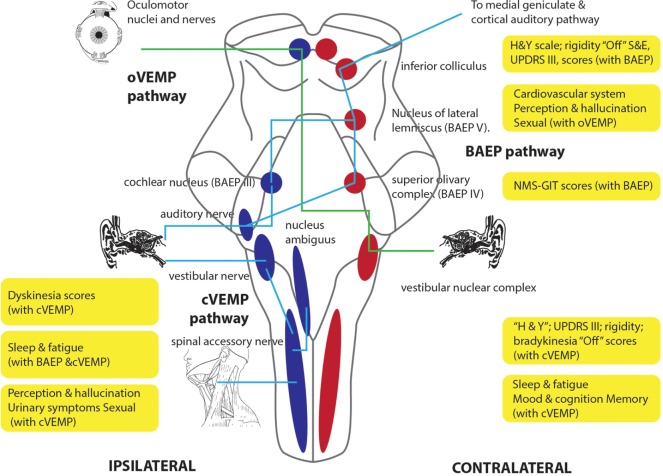
Figure 2.
The schematic diagram describes the topographic distribution of different motor and non-motor manifestations of Parkinson’s disease patients according to its correlation with BAEP, cVEMP, and oVEMP abnormal responses in the current study. BAEPs, brainstem auditory-evoked potentials; cVEMPs, cervical vestibular-evoked myogenic potentials; oVEMP, ocular VEMPs.

