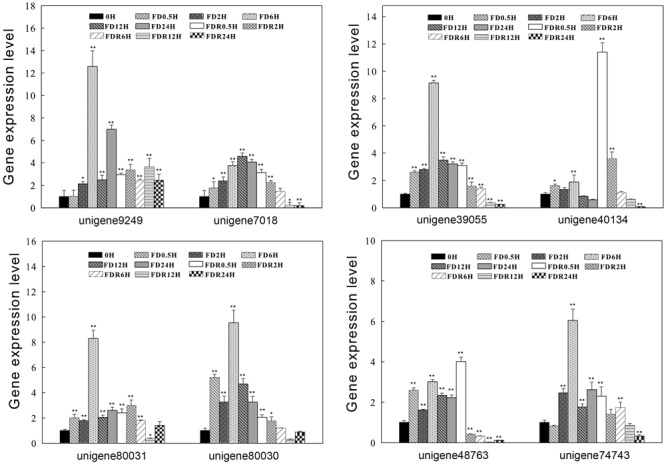
FIGURE 6.

Expression profiles of eight ScDREB genes during S. caninervis dehydration-rehydration process. The relative gene expression levels were calculated relative to 0 h and using 2-ΔΔCT method. The data shown are the mean values ± SE of three replicates, and the significance level relative to controls is ∗P < 0.05, ∗∗P < 0.01.
