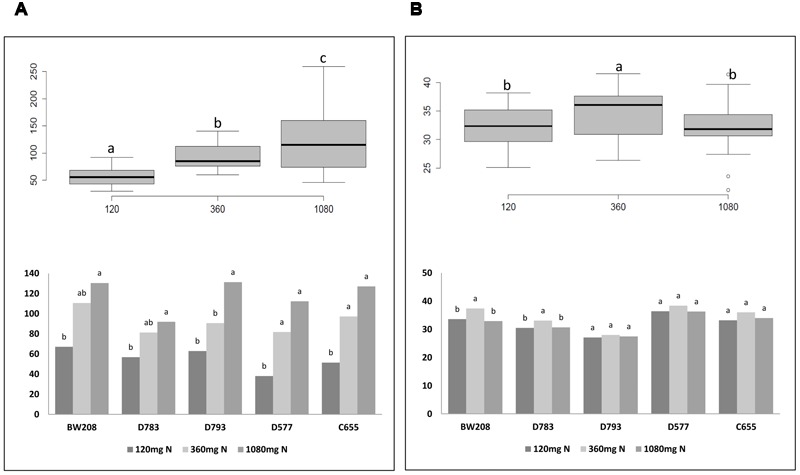
FIGURE 3.

Number of grains (A) and kernel weight (g) (B) from Experiment 1. Box plots figures represent the number of grains per plant (A) and kernel weight (B) with respect to N fertilization; bar charts describe the number of grains per plant (A) and kernel weight (B) from each line with N fertilization. Means with the same letter for each line and N treatment are not significantly different as determined by LSD multiple comparisons at p < 0.05.
