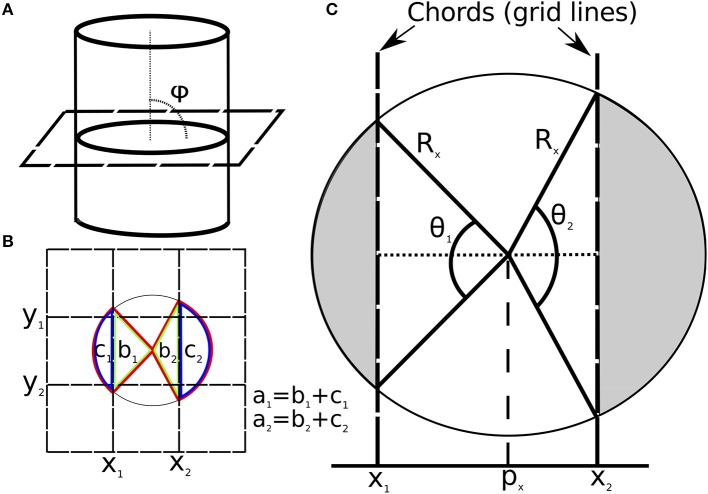
Figure 2.
(A) Diagram showing the angle (φ = 90°) between an image slice and a vein. (B) Vein cross-section overlaid with image grid. Grid lines are selected as chords for the x-axis (x1, x2) and y-axis (y1, y2). The sector for x1 and x2 are labeled (in red) a1 and a2 respectively. The triangles for x1 and x2 are labeled (in green) b1 and b2 respectively. The segment area for x1 and x2 are labeled (in blue) c1 and c2 respectively. (C) Diagram of vein cross-section on image plane overlaid with model parameters for the x-axis. The shaded sections show the circular area outside the image grid lines (segments). Note: ICF is not limited to the case of φ = 90°, this is chosen to simplify the diagram.

