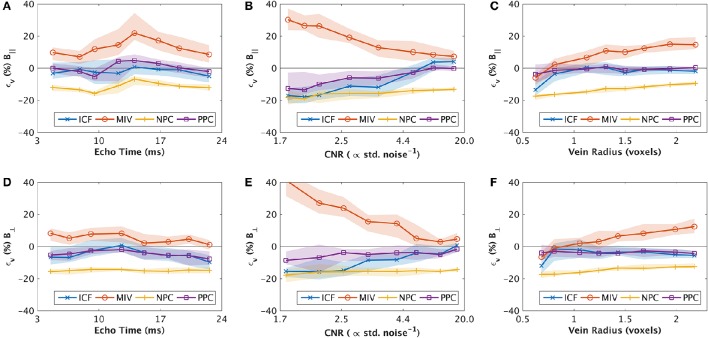
Figure 4.
Binned results of synthetic experiments 1, 2 and 3 for varied echo time (A,D) contrast-to-noise (B,E) and radius (C,E) respectively, showing the median (line) and inter-quartile range (shaded). Results are separated into those that were in parallel alignment to the main field (A–C, top row), and perpendicular to the main field (D–F, bottom row). The values are interpolated between estimates for each bin. The y-axis (ϵv) shows the signed error in estimates of oxygen extraction fraction (OEF). Negative values are under-estimates of OEF. Unless stated in Table 2, all parameter values are described in Table 1.

