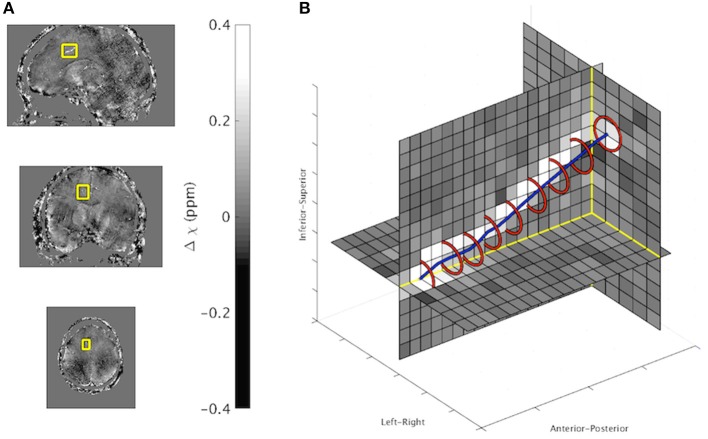
Figure 5.
(A) In vivo QSM maps in sagittal (top), coronal (middle), and axial (bottom) orientation. The border of the vein analyzed is overlaid. (B) Zoomed in 3D display of vein region with overlaid ICF output (Red: Vein boundary, Blue: Line connecting vein center points). ICF estimates: χvein = 0.32 ppm, Radius 0.92. MIV estimate: χvein = 0.33 ppm.

