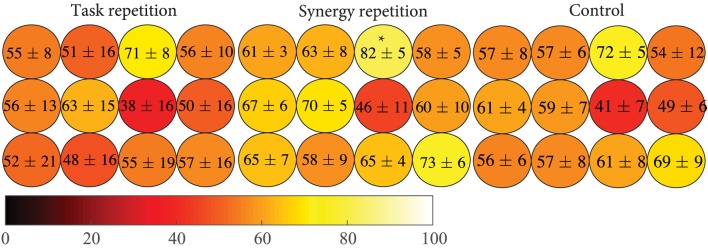
Figure 10.
Individual button-based performance was calculated for each group. The color scale indicates the percentage of tasks correct with lighter colors representing better performance. The synergy repetition group shows better performance overall but only was only significantly greater than the task repetition group (p = 0.032) at ring, maximum extension (indicated by the *).

