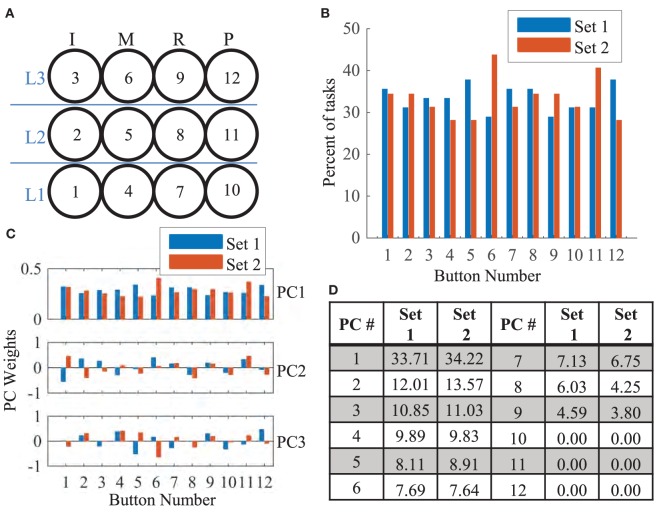
Figure 4.
(A) The 3 × 4 button grid required three levels of extension (labeled in blue) for each finger [index (I), middle (M), ring (R), and pinky (P)]. For reference, each button number is provided in black. (B) The percent number of tasks that involved a specific button is shown for set 1 (blue) and set 2 (red). Buttons 5, 6, 11, and 12 showed differences in frequency. (C) The first 3 (of 12) principal components derived from set 1 and set 2 tasks are shown. In PC1, weight proportions are similar to (B). In the remaining PCs, the covariance patterns are distributed. (D) The fraction of variance that each of the 12 PCs account for is shown. Distributions of variance are similar across both groups.

