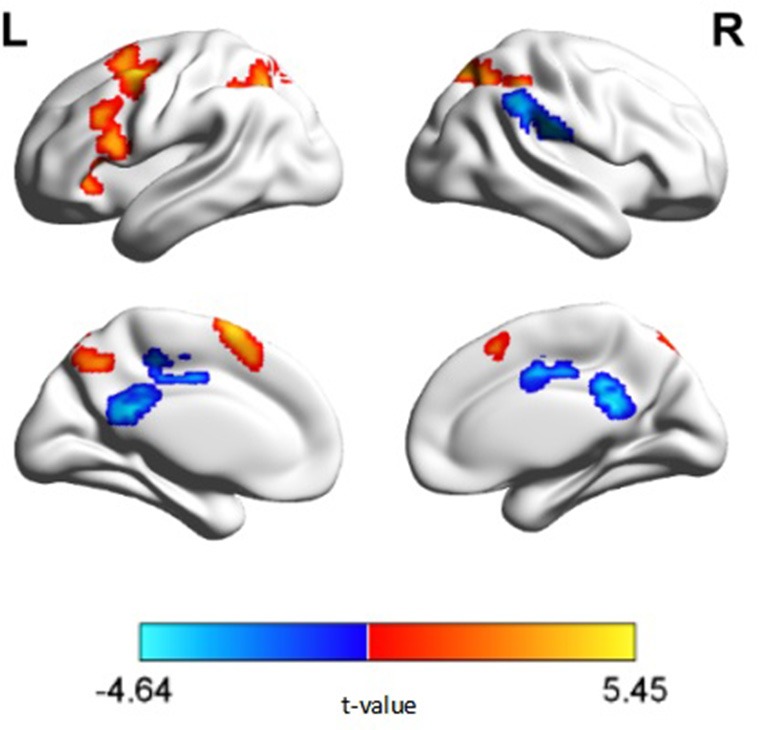
Figure 2.

N-back activation map of between group comparisons (p < 0.05, corrected, cluster size = 108). Warm colors represent regions exhibiting decreased activation, while cold colors represent regions exhibiting decreased deactivation, in patients with schizophrenia relative to healthy controls.
