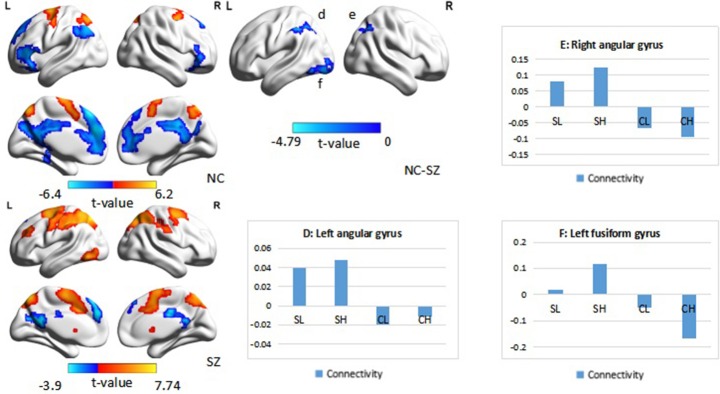
Figure 5.
Psychophysiological interaction effect using the left DLPFC as the seed region in each group and between group effects (p < 0.05, corrected, cluster size = 86). The color bar represents the t-values. Averaged connectivity strength for each region in each subgroup is shown in the corresponding plots. SL, low-performance schizophrenia group; SH, high-performance schizophrenia group; CL, low-performance control group; CH, high-performance control group.

