
Figure 3.
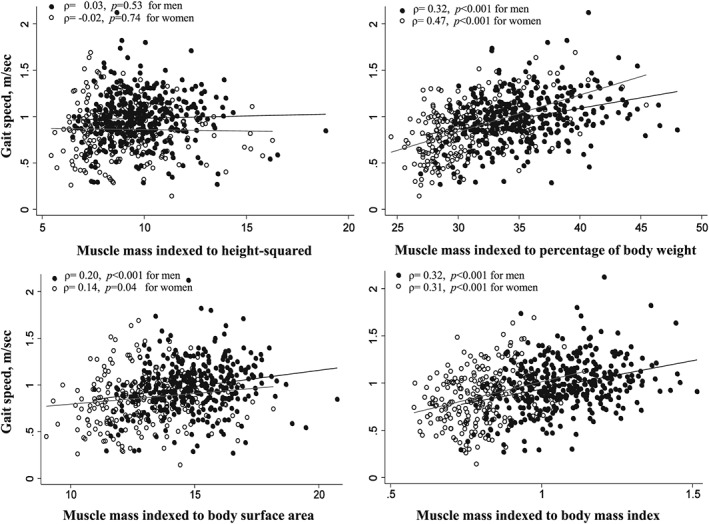
Scatter plot between total‐body muscle mass indexed to height2, percentage of body weight, body surface area, and body mass index and physical performance (gait speed).
Official websites use .gov
A
.gov website belongs to an official
government organization in the United States.
Secure .gov websites use HTTPS
A lock (
) or https:// means you've safely
connected to the .gov website. Share sensitive
information only on official, secure websites.
Scatter plot between total‐body muscle mass indexed to height2, percentage of body weight, body surface area, and body mass index and physical performance (gait speed).