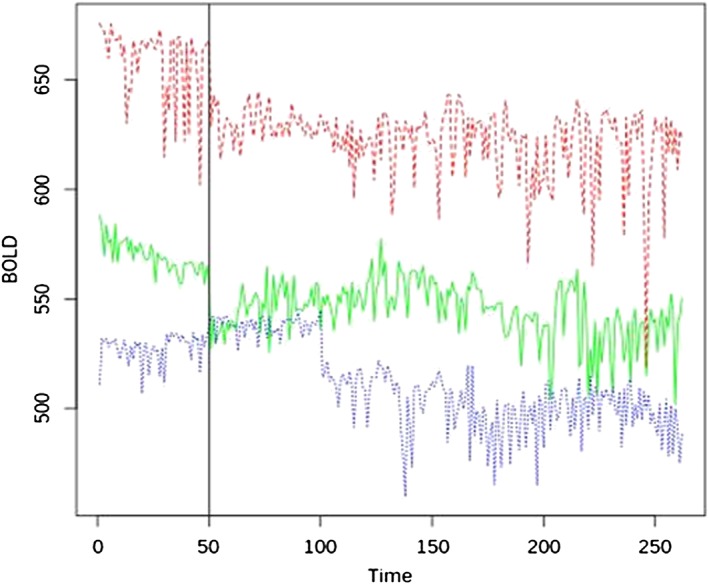
Figure 2.

The three different lines indicate the raw BOLD in each group during functional magnetic resonance imaging scansion at baseline (time frame 0–50) and after the standard meal assumption (time frame 51–262). Red line indicates non‐anorexic cancer patients, green line indicates anorexic cancer patients, and blue line indicates control group.
