
Figure 1.
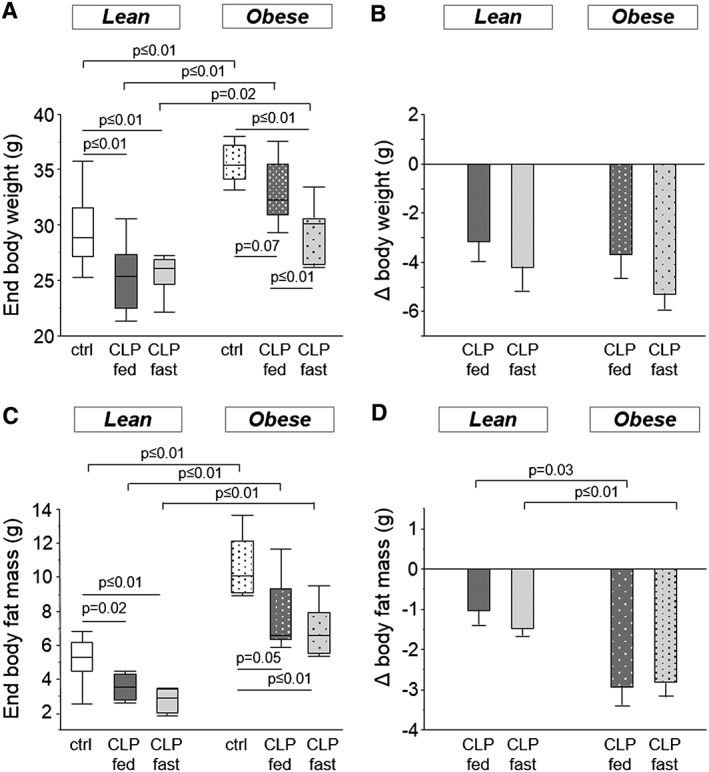
Mice body composition. (a) Body weight after 5 days of CLP‐induced critical illness (ANOVA P ≤ 0.01). (b) Loss of body weight during the 5 day experiment (ANOVA P = 0.4). (c) End body fat mass, measured by DEXA (ANOVA P ≤ 0.01). (d) Loss in body fat mass during 5 days of critical illness (ANOVA P ≤ 0.01). White, healthy lean mice (n = 8); dark gray, fed lean CLP mice (n = 7); light gray, fasted lean CLP mice (n = 9); white dotted, healthy obese mice (n = 9); dark gray dotted, fed obese CLP mice (n = 10); light gray dotted, fasted obese CLP mice (n = 9). [DEXA: dual‐energy‐X‐ray‐absorptiometry, CLP: cecal ligation and puncture, ctrl: healthy control animals, fed: parenterally fed, fast: fasted]