
Figure 4.
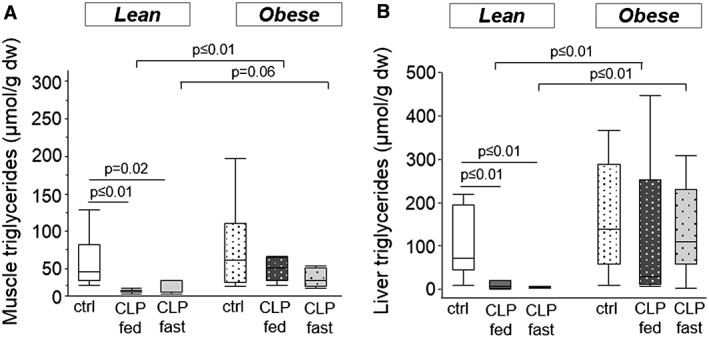
Mice muscle and hepatic triglyceride content. (a) Triglyceride content of skeletal muscle tissue (Mann–Whitney P ≤ 0.01). (b) Hepatic triglyceride content (Mann–Whitney P ≤ 0.01). White, healthy lean mice (n = 8); dark gray, fed lean CLP mice (n = 7); light gray, fasted lean CLP mice (n = 9); white dotted, healthy obese mice (n = 9); dark gray dotted, fed obese CLP mice (n = 10); light gray dotted, fasted obese CLP mice (n = 9). [dw: dry weight, CLP: cecal ligation and puncture, ctrl: healthy control animals, fed: parenterally fed, fast: fasted]