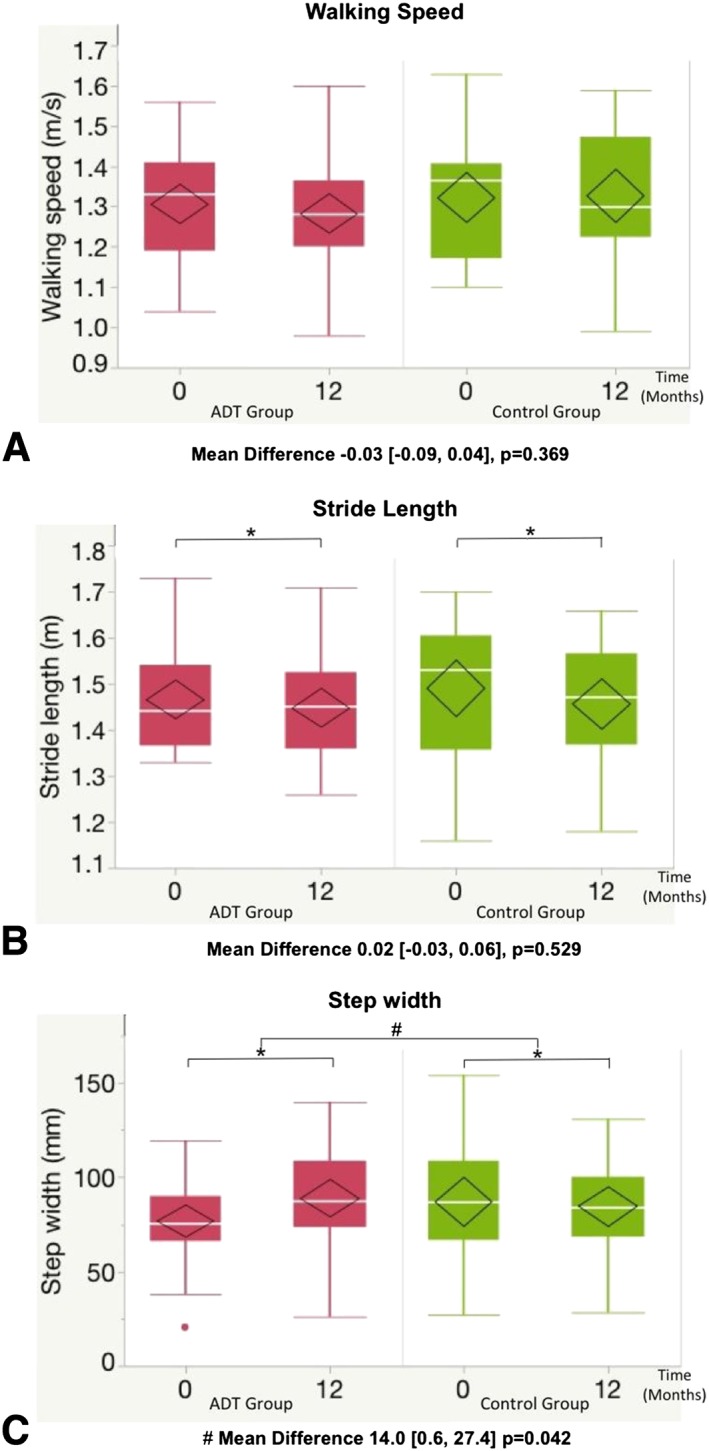
Figure 4.

Temporal‐spatial parameters. Mean difference refers to the difference in the change in the mean of the ADT group over change in the mean of the control group over 12 months and is presented with (95% confidence interval) and P value. # P < 0.05 represents a significant difference in the change in the mean of the ADT group compared with the change in the control group over 12 months (main outcome). * P < 0.05 represents a significant difference between the mean 12‐month value and mean baseline value within the same group. No significant interactions were observed from 0 to 6 months. Box plots demonstrate median, interquartile range, and range. The diamond represents the mean and the 95% confidence interval of the mean.
